Before-and-after images show how air pollution levels have dropped around the world amid COVID-19 lockdowns
Social distancing and stay home orders halt field research on salmon migration
Social distancing and stay home orders halt field research on salmon migration
With so many people under stay-at-home orders around the world to help combat the spread of the novel coronavirus, these changes — while at a high cost — have also positively impacted the environment.
Striking before-and-after photos released by NASA and other agencies reveal significant reductions in air pollution over different metropolitan areas.
NEW YORK
Nitrogen dioxide pollution, emitted by motor vehicles, power plants and industrial facilities, is down 30% in the Northeastern United States, according to NASA.

A map by NASA shows the average concentration of nitrogen dioxide from March 2015 to March 2019. (Photo credit: NASA's Scientific Visualization Studio)
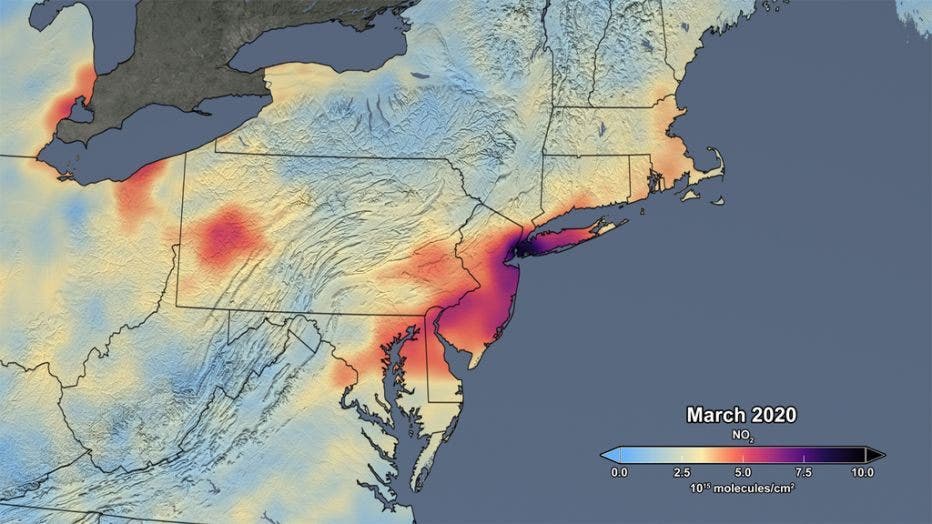
A map by NASA shows the average concentration of nitrogen dioxide in March 2020 as people stay home to help stop the spread of COVID-19. (Photo credit: NASA's Scientific Visualization Studio)
CALIFORNIA
The shutdown of businesses and activities related to COVID-19 also led to a similar decrease of air pollution over California, according to researchers with NASA’s Short-Term Prediction Research and Transition Center.
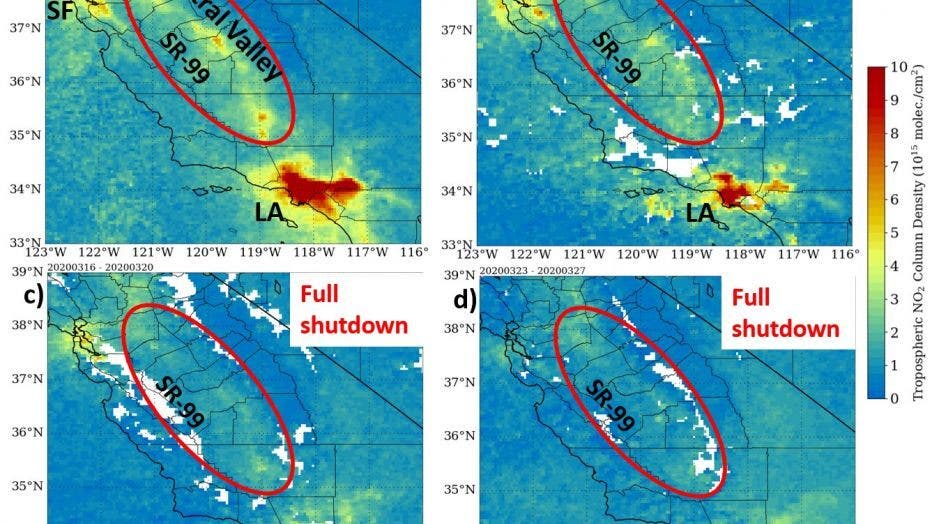
Maps shared by NASA show nitrogen dioxide levels over California during March 2-6, 2020, pre-shutdown against the coronavirus, March 9-13 during a soft shutdown, March 16-20 when "shelter in place" orders were announced, and March 23-27 during a full
EUROPE
In Europe, similar changes were observed from mid-March to mid-April, compared to a year ago.
Air pollution levels in Madrid, Milan and Rome saw decreases of around 45%, while Paris saw a dramatic drop of 54% – coinciding with when strict quarantine measures were implemented across Europe, according to scientists from the Royal Netherlands Meteorological Institute.
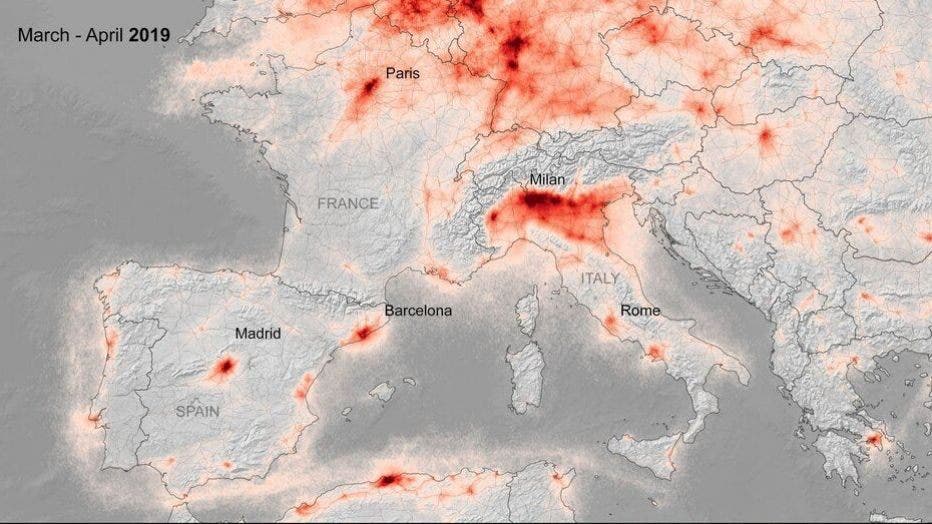
The average nitrogen dioxide concentrations over Europe in March - April 2019. (Photo credit: Royal Netherlands Meteorological Institute via European Space Agency)
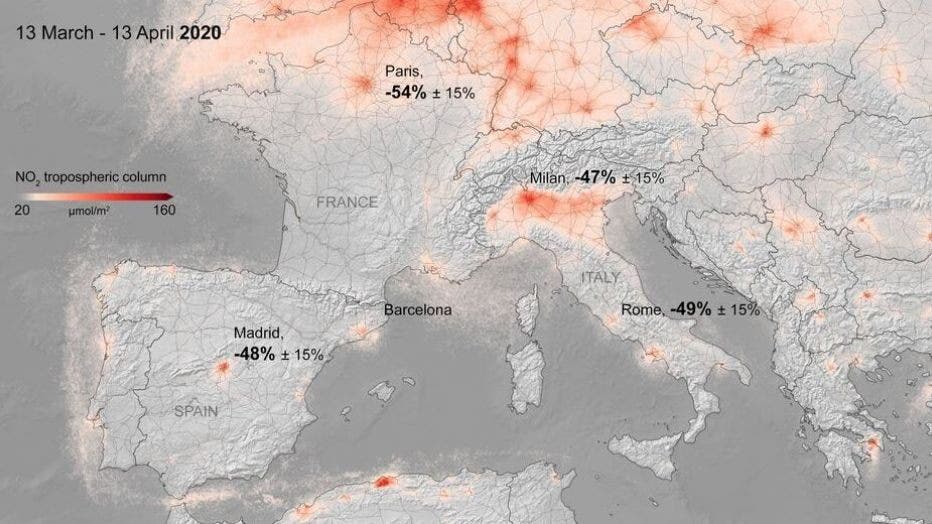
The average nitrogen dioxide concentrations over Europe from March 13 - April 13, 2020 during a lockdown against the COVID-19 coronavirus. (Photo credit: Royal Netherlands Meteorological Institute via European Space Agency)
INDIA
With vehicles off the road and industries shutdown in India to help combat the spread of COVID-19, the world’s most polluted capital of New Delhi has experienced cleaner air.
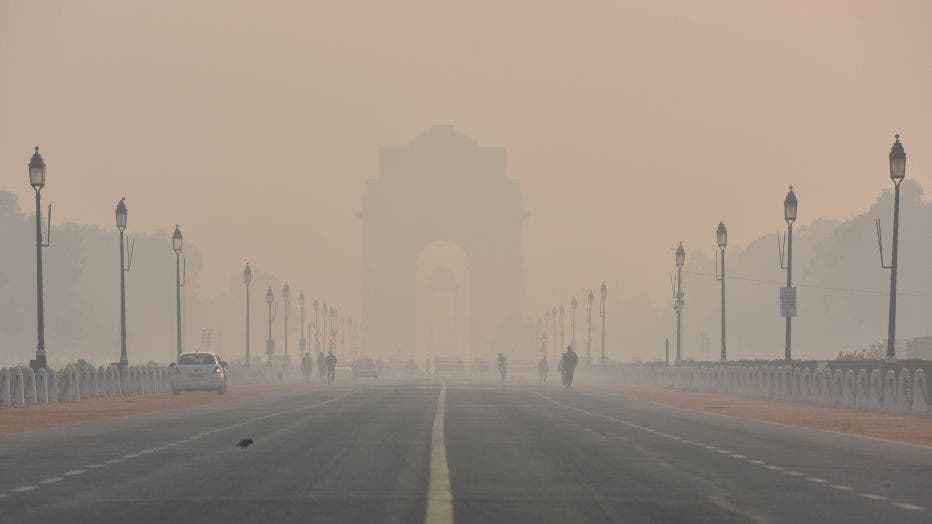
A file image taken Nov. 21, 2019 shows heavy smog engulfing India Gate in New Delhi, India. (Photo by Sanchit Khanna/Hindustan Times via Getty Images)

Clouds hover over the sky at India Gate during the lockdown to limit the coronavirus on April 20, 2020 in New Delhi, India. (Photo by Mohd Zakir/Hindustan Times via Getty Images)
CHINA
Scientists also detected significant decreases in air pollution over China, with evidence that the change is “at least partly related to the economic slowdown following the outbreak of coronavirus,” NASA said.
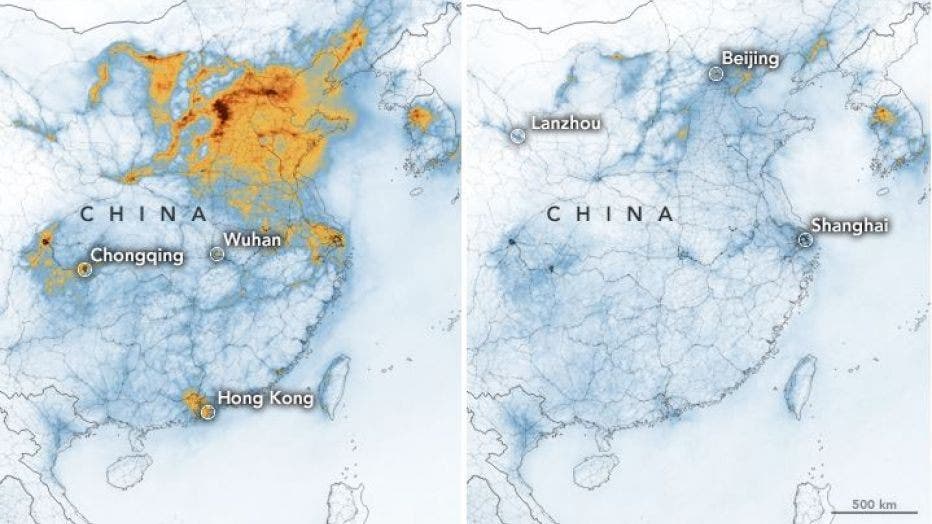
A map released by NASA shows nitrogen dioxide levels over China between Jan. 1-20, 2020, before the quarantine, and Feb. 10-25, 2020, during the quarantine. (Photo credit: NASA Earth Observatory images by Joshua Stevens)
In some areas, stay-at-home orders and business shutdowns are made apparent through satellite images showing light changes. Photos shared by NASA show lighting changes in Jianghan District, a commercial area of Wuhan, China considered to be the outbreak’s epicenter, amid the COVID-19 quarantine.
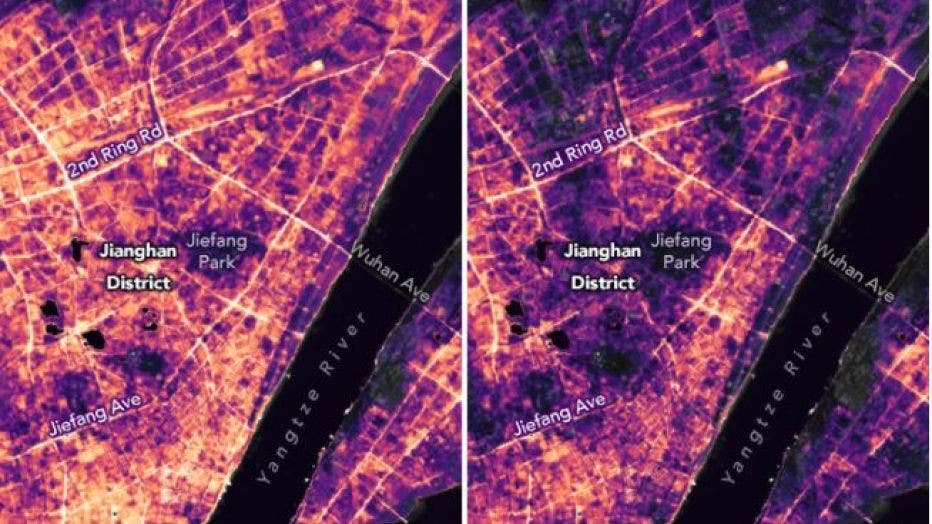
The Jianghan District, a commercial area of Wuhan, China, and nearby residential areas are shown in NASA satellite images on Jan. 19, 2020, before the COVID-19 quarantine, and Feb. 4, 2020, during the quarantine. (Photo credit: Joshua Stevens, Ranjay
RELATED: MAP: This is where there are confirmed coronavirus cases in the US and around the world
RELATED: CoronavirusNOW.com, FOX launches national hub for COVID-19 news and updates
This story was reported from Cincinnati.

