

The states that spend the most (and least) on public education
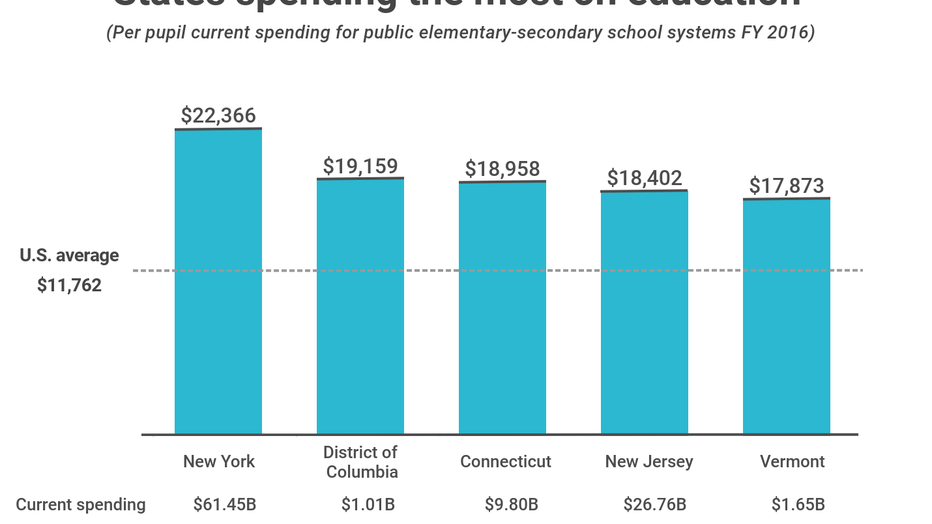
In the wake of multiple teacher strikes that have prompted national attention towards educators’ salaries and education spending, the U.S. Census Bureau just released its updated Annual Survey of School System Finances covering Fiscal Year 2016. According to the report, total current spending of public elementary-secondary school systems for the U.S. in 2016 was $587 billion, a 3.3% increase from 2015. With over 48 million students enrolled in school in the U.S., the per pupil current spending nationwide is $11,762, an increase of 3.2% since 2015.
Whether increased spending yields better outcomes or is a sign of bloated administrative costs is controversial. A recent study conducted by the University of California, Berkeley has indicated that higher education spending correlates with higher scores on the federal NAEP exam, while another study from the National Center for Education Evaluation and Regional Assistance reported no correlation between spending and test scores or graduation rates. Critics of educational spending argue that too much of the education budget (almost 40% at the national level) is allocated for teacher salaries, which average $58,950 nationwide, and should be spent on other programs and resources for students.
While in part funded from federal sources, public education in the U.S. is predominantly financed by state and local revenue sources, which creates large disparities in spending across states. To identify which states spend the most and least on public education, Credit Sesame, a credit score and financial management platform, analyzed the most recent U.S. Census Bureau data released in May of 2018. To compare spending figures against teacher salaries and student outcomes, Credit Sesame also incorporated data from the National Education Association, U.S. Department of Education, and the National Assessment of Educational Progress (NAEP).
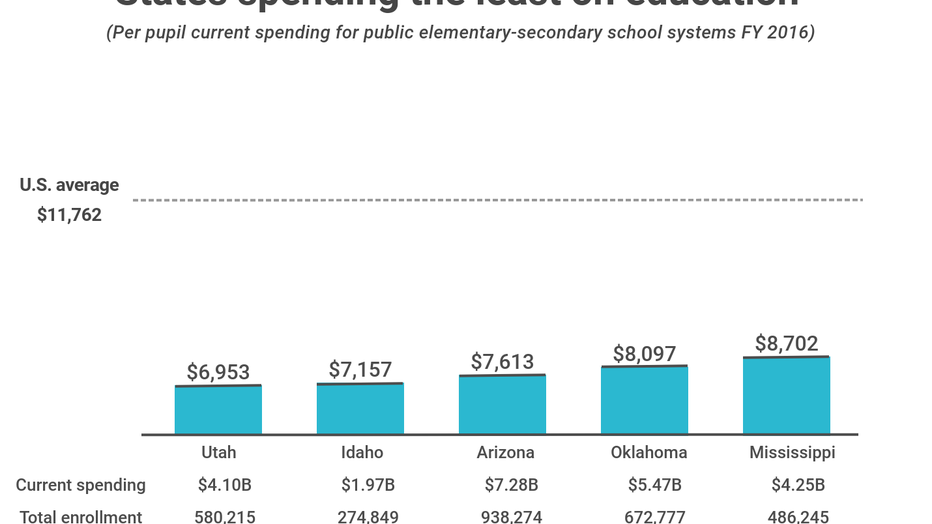
Based on the analysis, states in the Northeast tend to spend the most money per pupil, with New York (ranked #1) spending three times more per pupil than Utah (ranked #51).
At the state level, per pupil spending is strongly correlated with average teacher salaries, which makes sense given the large portion of the budget that goes towards instructor salaries. However, when comparing state-level student outcomes (such as NAEP scores and graduation rates) with per pupil current spending, Credit Sesame found no obvious correlations—meaning that states spending the most per student today don’t appear to have better outcomes. In fact, some states such as Washington, D.C., Alaska, and Hawaii have significantly above average spending and below average academic performance. Conversely, states such as Utah, Indiana, Colorado, and Idaho appear to be doing more with less. Their students outperform those in other states on national assessments despite below average spending.
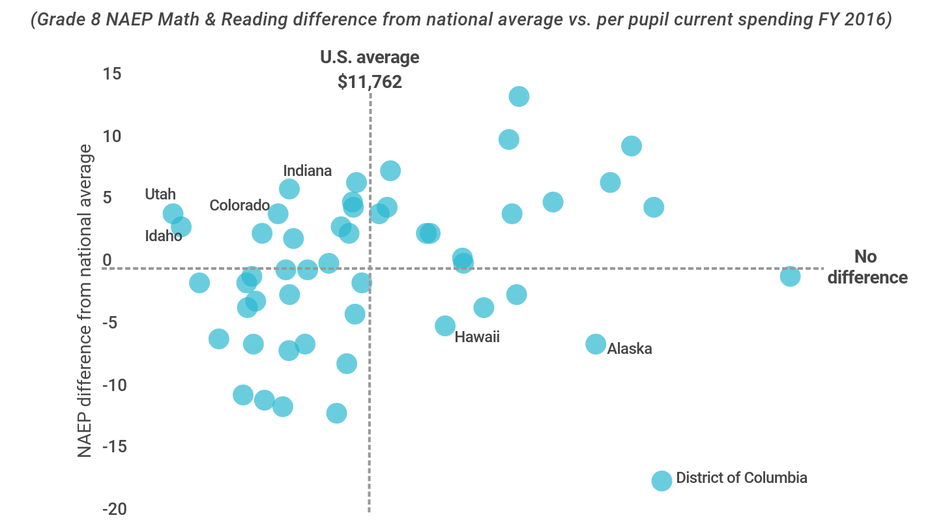
This analysis suggests that when it comes to improving academic performance, the availability of funds is only part of the equation. Where, when, and how such funds are deployed are likely more impactful than the total amount being spent. That said, whether you’re a new parent evaluating public school options in your state or just a concerned citizen, the list below—ranked by per pupil current spending—will show how your state stacks up.
The states ranked (least to most spending):

Photo Credit: Zoonar GmbH / Alamy Stock Photo
51. Utah

Photo Credit: Charles Knowles / Alamy Stock Photo
50. Idaho

Photo Credit: Andrew Zarivny / Alamy Stock Photo
49. Arizona
Photo Credit: Dave Newman / Alamy Stock Photo
48. Oklahoma
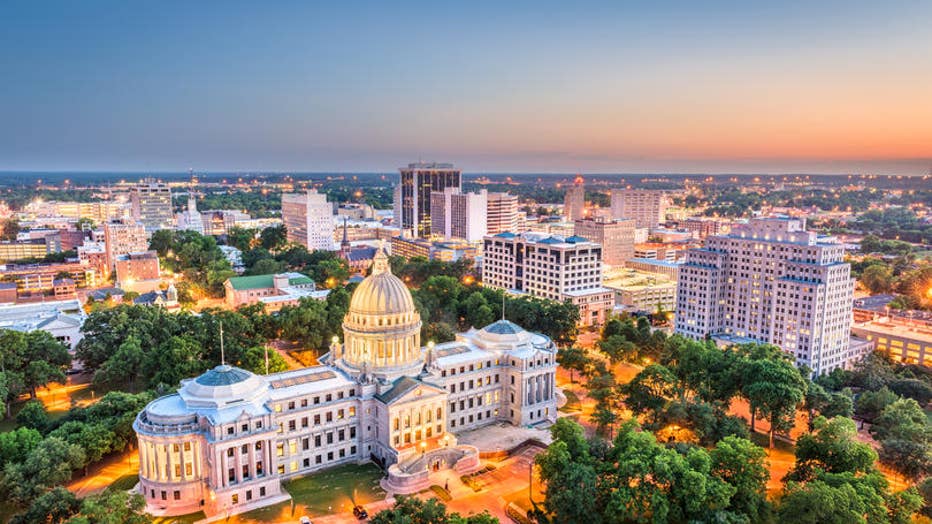
Photo Credit: Sean Pavone / Alamy Stock Photo
47. Mississippi

Photo Credit: Sean Pavone / Alamy Stock Photo
46. North Carolina

Photo Credit: Sean Pavone / Alamy Stock Photo
45. Tennessee

Photo Credit: Sean Pavone / Alamy Stock Photo
44. Florida
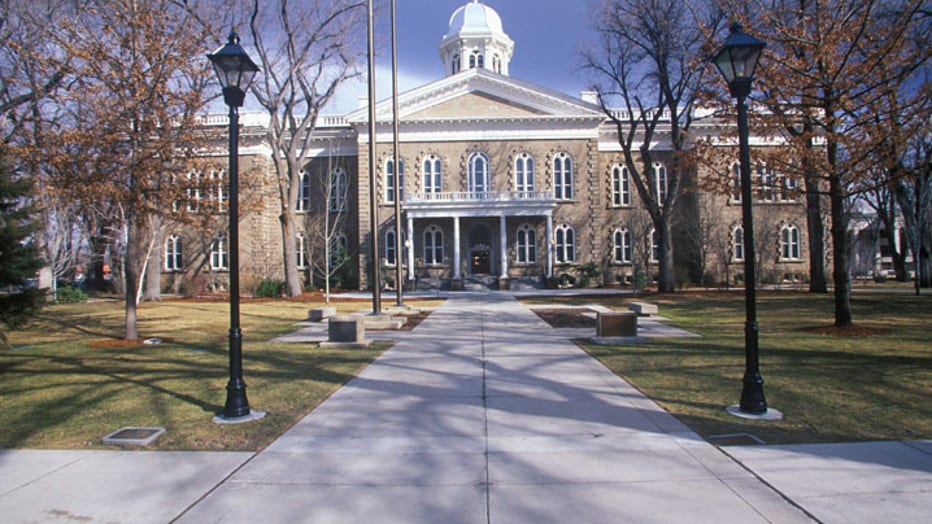
Photo Credit: Visions of America, LLC / Alamy Stock Photo
43. Nevada

Photo Credit: Sean Pavone / Alamy Stock Photo
42. Texas

Photo Credit: Chris Boswell / Alamy Stock Photo
41. South Dakota
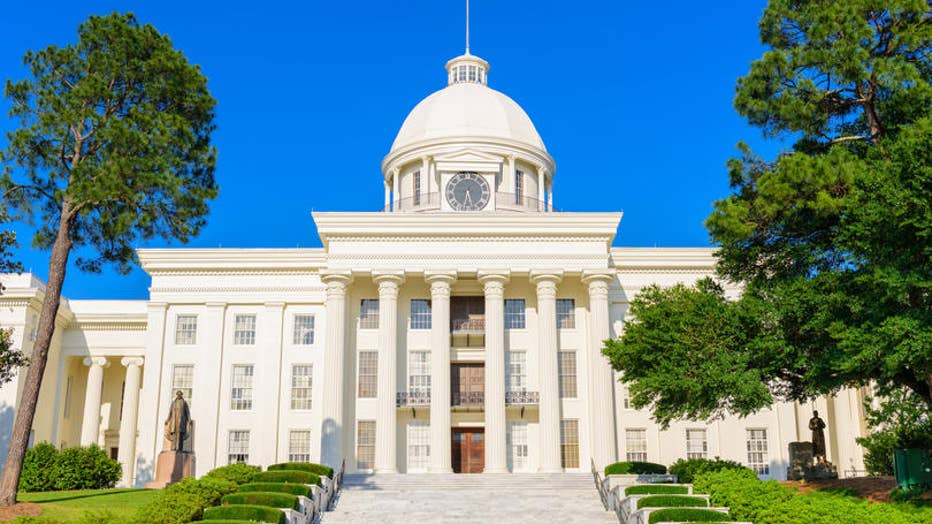
Photo Credit: Sean Pavone / Alamy Stock Photo
40. Alabama

Photo Credit: Joe Ferrer / Alamy Stock Photo
39. Colorado
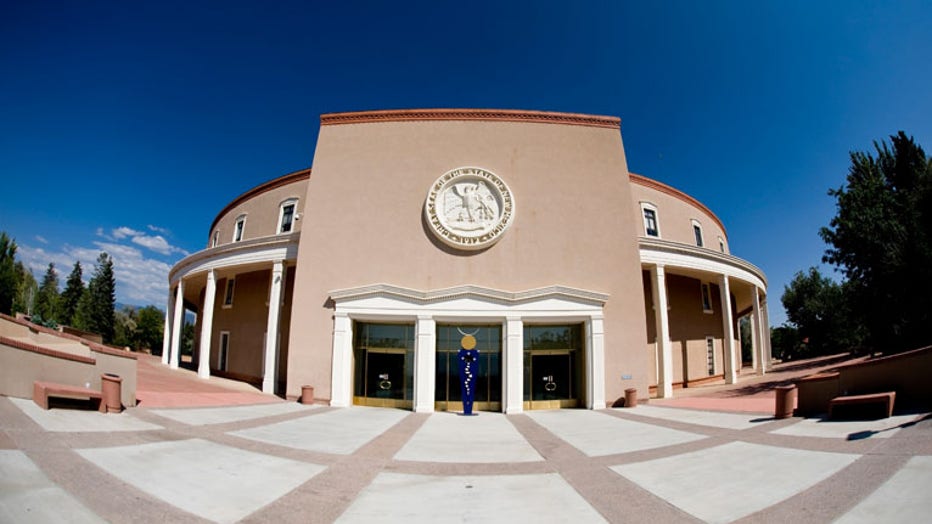
Photo Credit: William Scott / Alamy Stock Photo
38. New Mexico
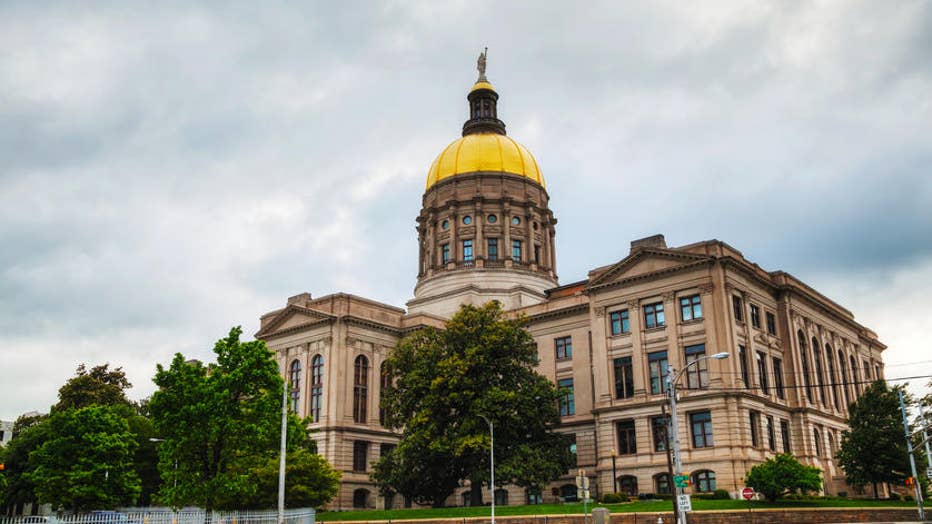
Photo Credit: Zoonar GmbH / Alamy Stock Photo
37. Georgia
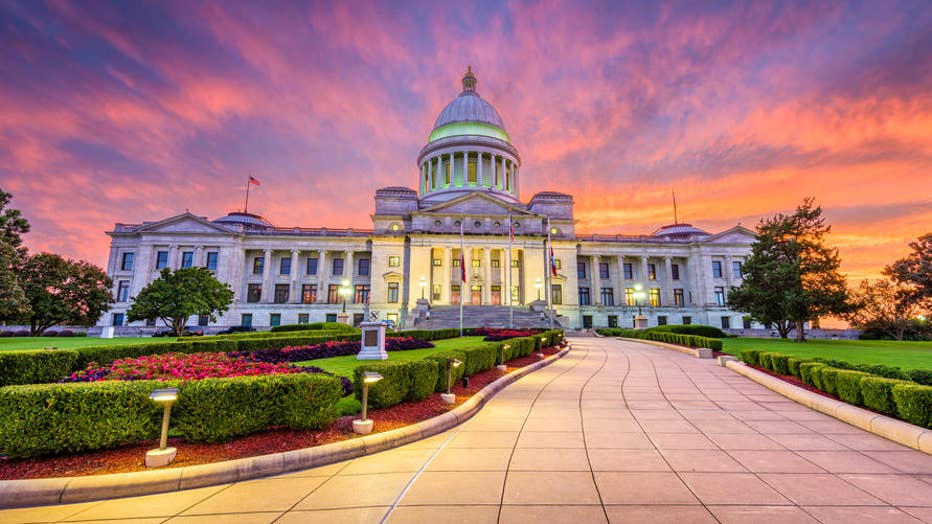
Photo Credit: Sean Pavone / Alamy Stock Photo
36. Arkansas

Photo Credit: Sean Pavone / Alamy Stock Photo
35. Indiana
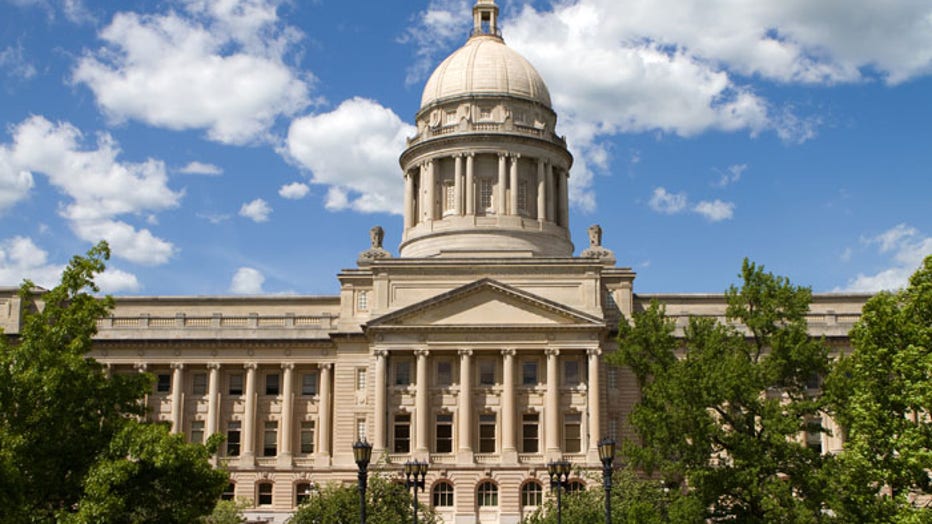
Photo Credit: Steven Frame / Alamy Stock Photo
34. Kentucky
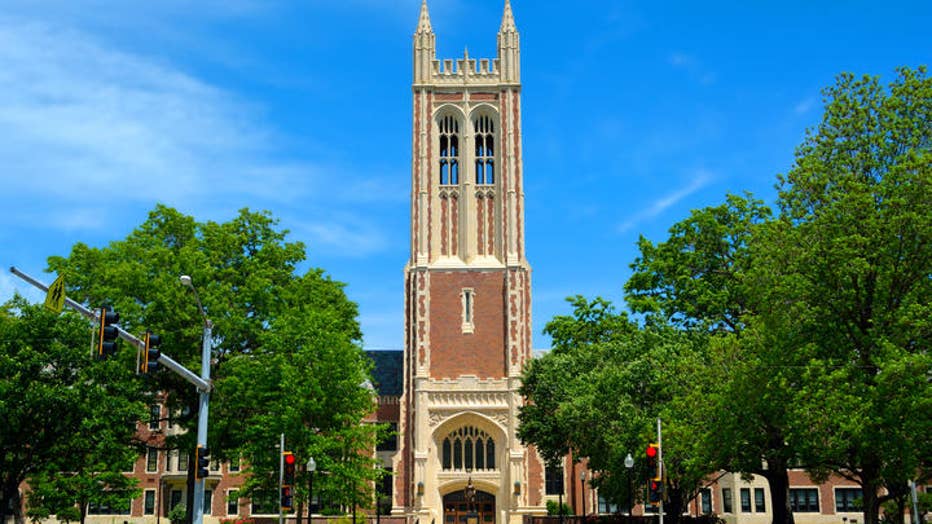
Photo Credit: Jeff Zehnder / Alamy Stock Photo
33. Kansas
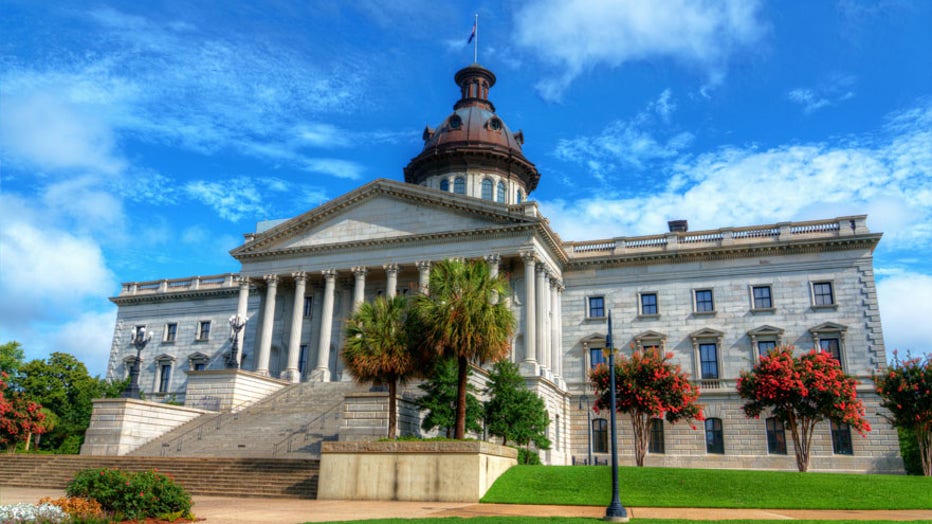
Photo Credit: Sean Pavone / Alamy Stock Photo
32. South Carolina
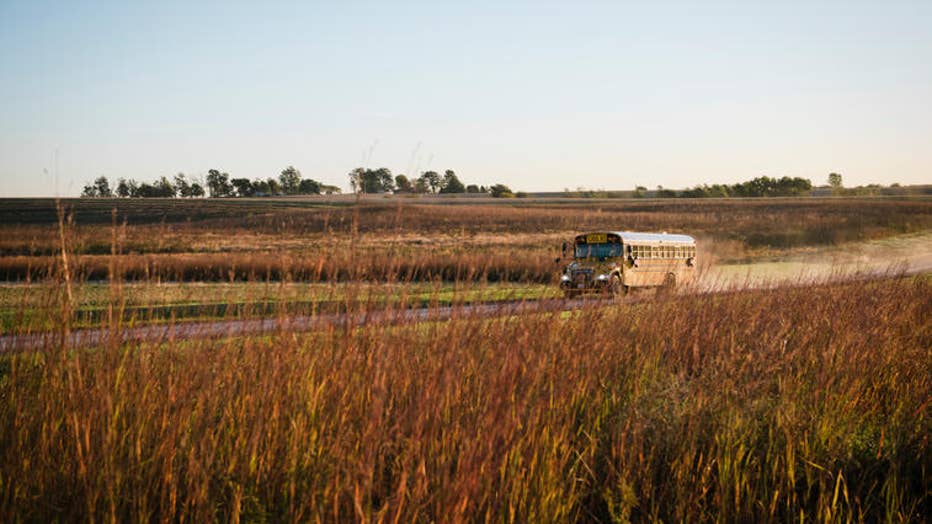
Photo Credit: Image Source / Alamy Stock Photo
31. Missouri

Photo Credit: Brian Overcast / Alamy Stock Photo
30. Oregon

Photo Credit: Sean Pavone / Alamy Stock Photo
29. Louisiana
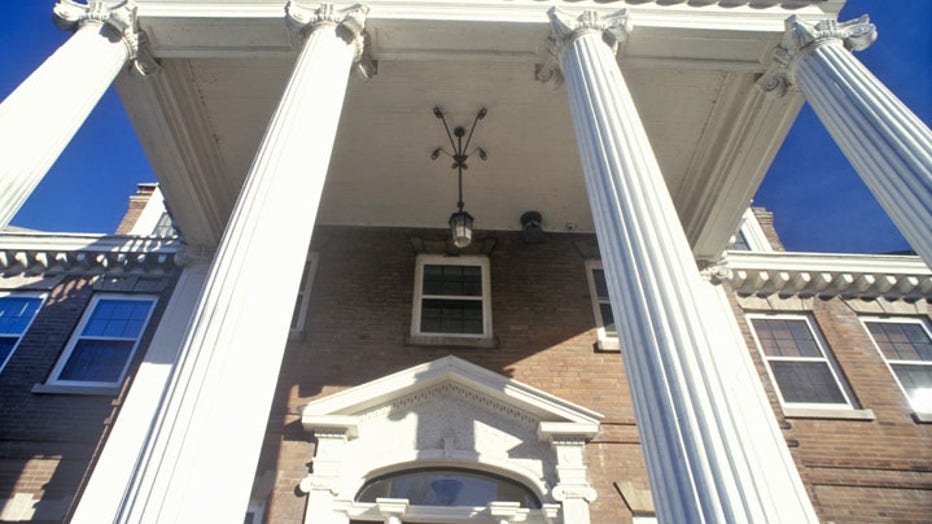
Photo Credit: Purestock / Alamy Stock Photo
28. Iowa
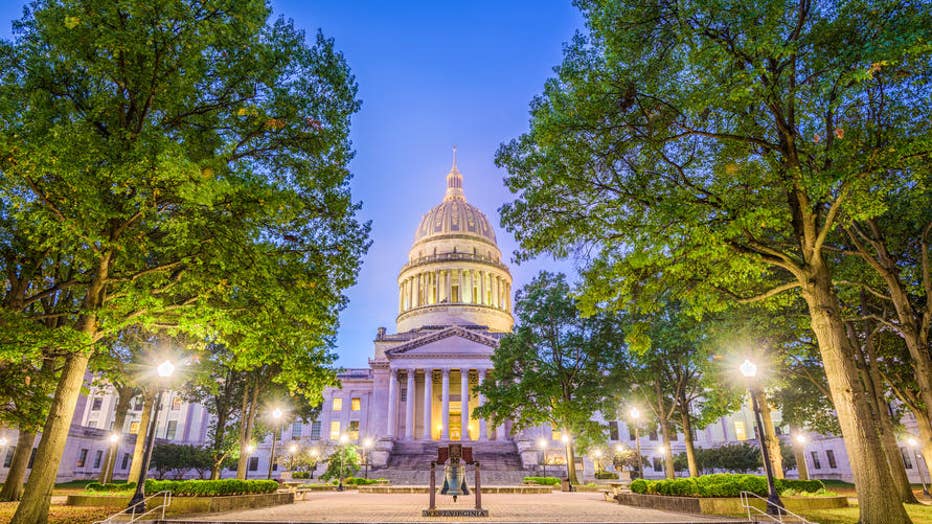
Photo Credit: Sean Pavone / Alamy Stock Photo
27. West Virginia
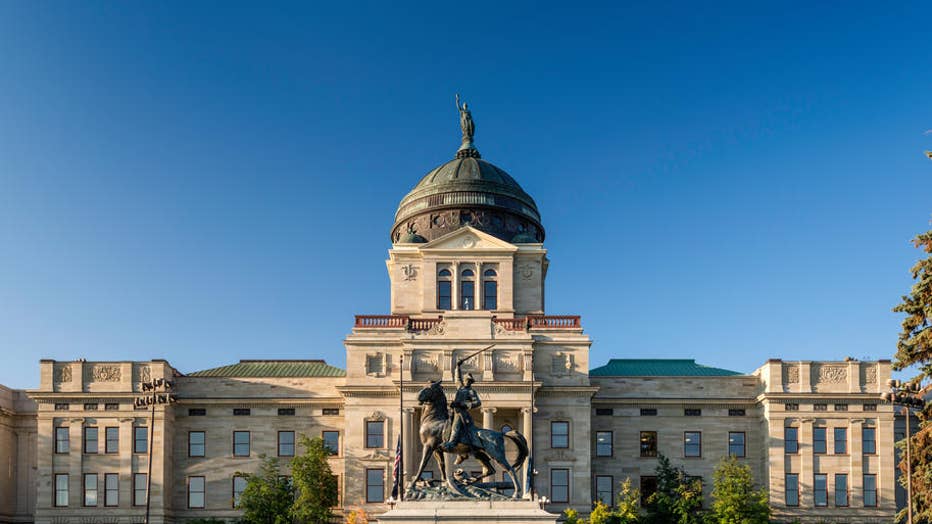
Photo Credit: Witold Skrypczak / Alamy Stock Photo
26. Montana

Photo Credit: Eric Franks / Alamy Stock Photo
25. Virginia
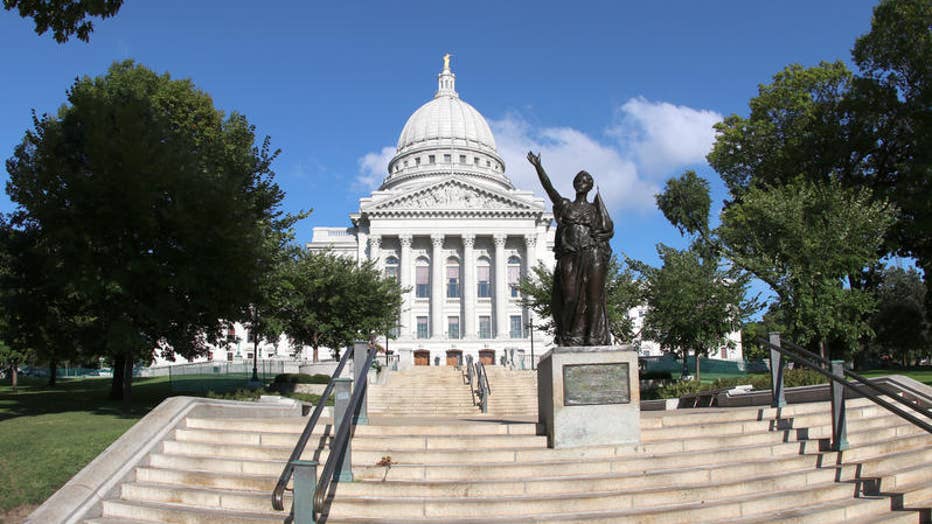
Photo Credit: Maryna Gumenyuk / Alamy Stock Photo
24. Wisconsin

Photo Credit: Adonis Villanueva / Alamy Stock Photo
23. California

Photo Credit: Image Source / Alamy Stock Photo
22. Washington
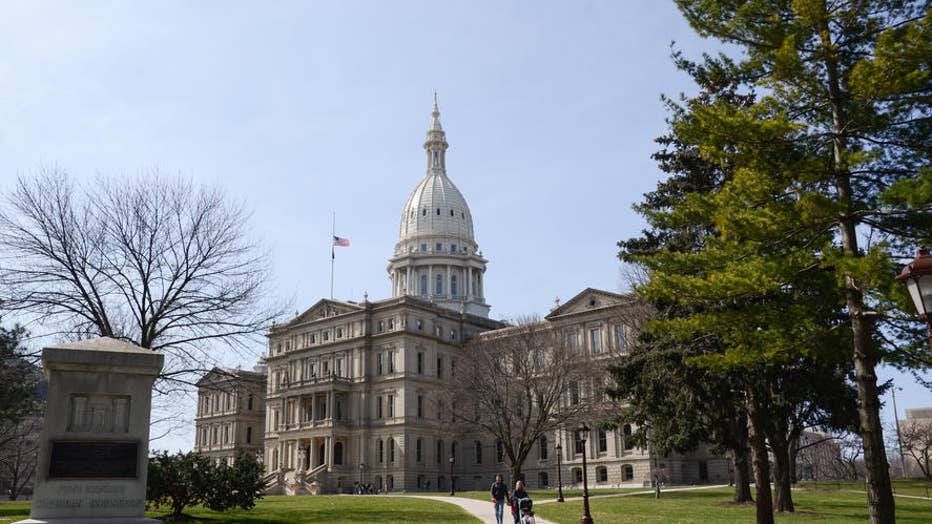
Photo Credit: Susan Montgomery / Alamy Stock Photo
21. Michigan

Photo Credit: Sean Pavone / Alamy Stock Photo
20. Ohio
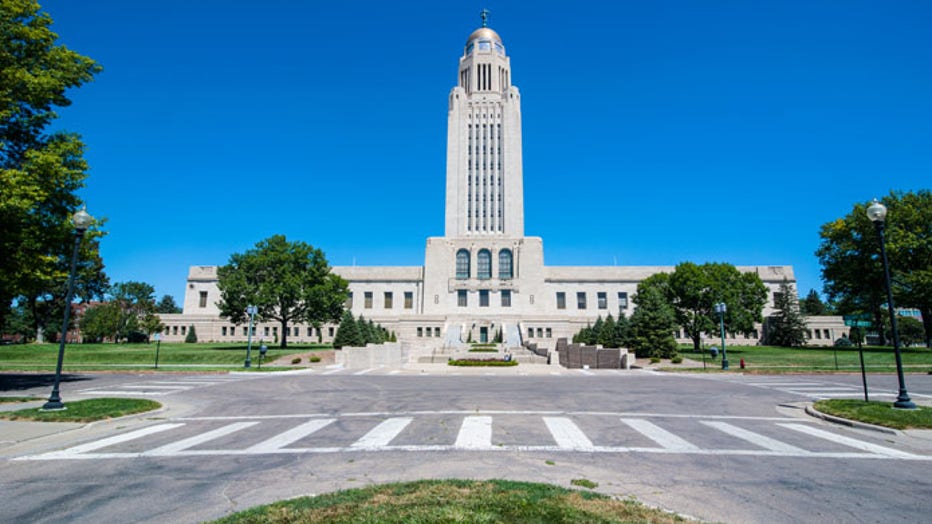
Photo Credit: robertharding / Alamy Stock Photo
19. Nebraska

Photo Credit: rudi1976 / Alamy Stock Photo
18. Minnesota
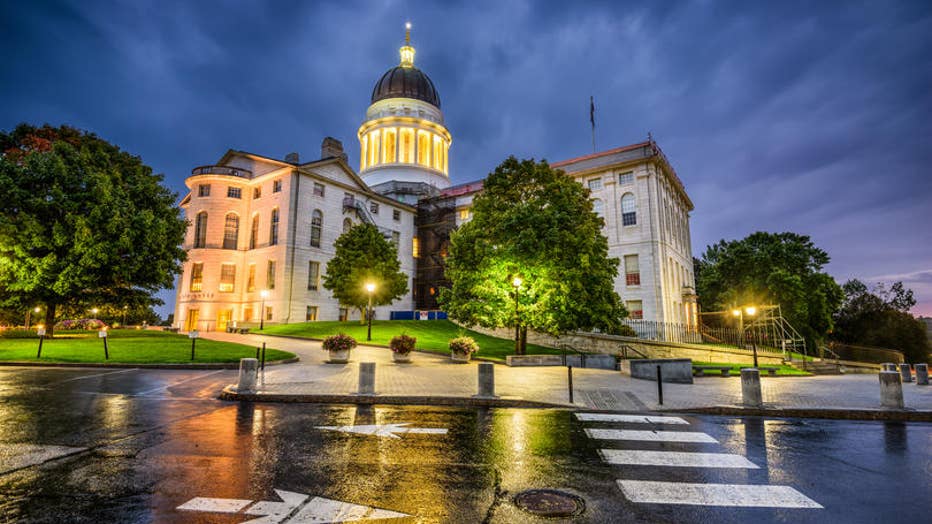
Photo Credit: Sean Pavone / Alamy Stock Photo
17. Maine
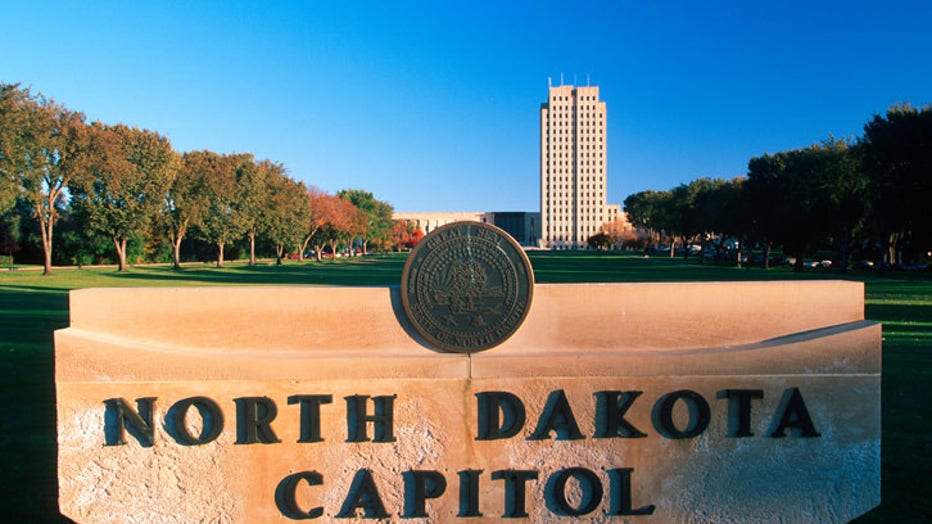
Photo Credit: Purestock / Alamy Stock Photo
16. North Dakota
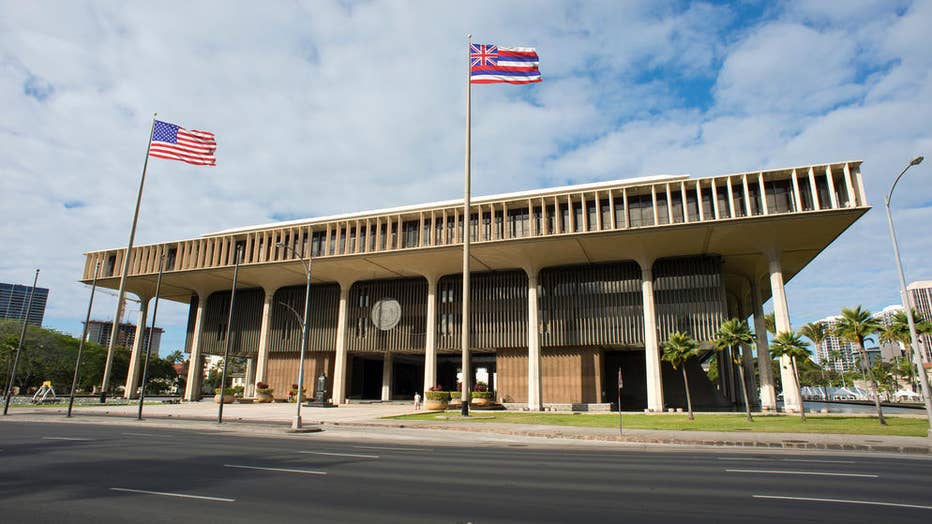
Photo Credit: Panther Media GmbH / Alamy Stock Photo
15. Hawaii
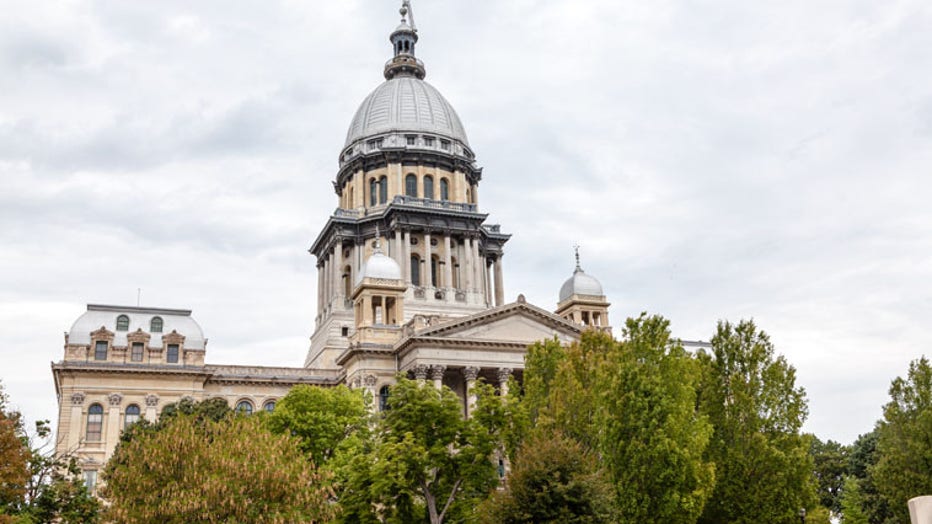
Photo Credit: Dave Newman / Alamy Stock Photo
14. Illinois

Photo Credit: Sean Pavone / Alamy Stock Photo
13. Maryland
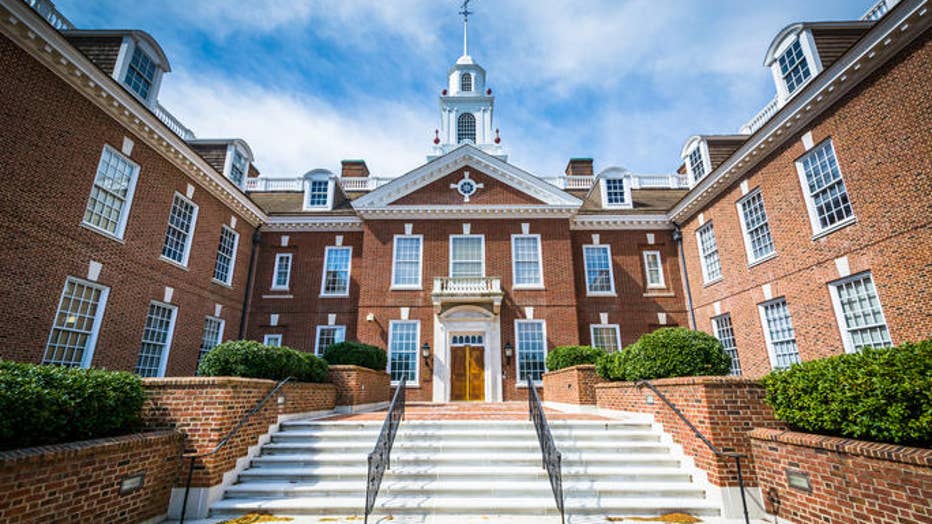
Photo Credit: Jon Bilous / Alamy Stock Photo
12. Delaware
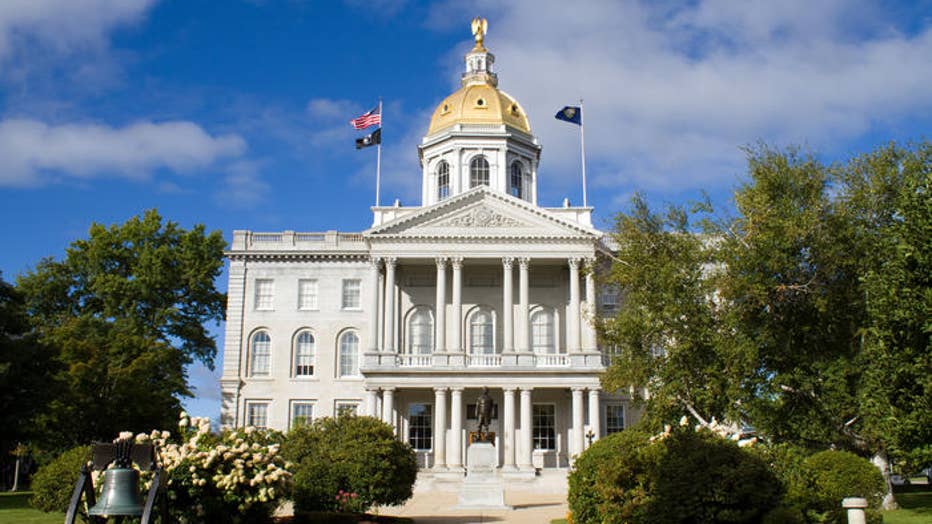
Photo Credit: Steven Frame / Alamy Stock Photo
11. New Hampshire

Photo Credit: Christian Hinkle / Alamy Stock Photo
10. Pennsylvania

Photo Credit: Sean Pavone / Alamy Stock Photo
9. Rhode Island

Photo Credit: Sean Pavone / Alamy Stock Photo
8. Massachusetts
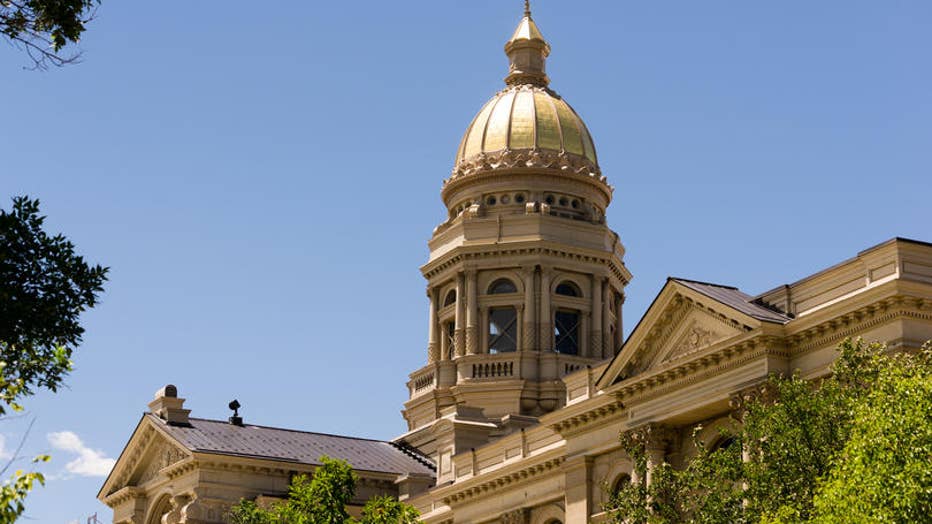
Photo Credit: Panther Media GmbH / Alamy Stock Photo
7. Wyoming
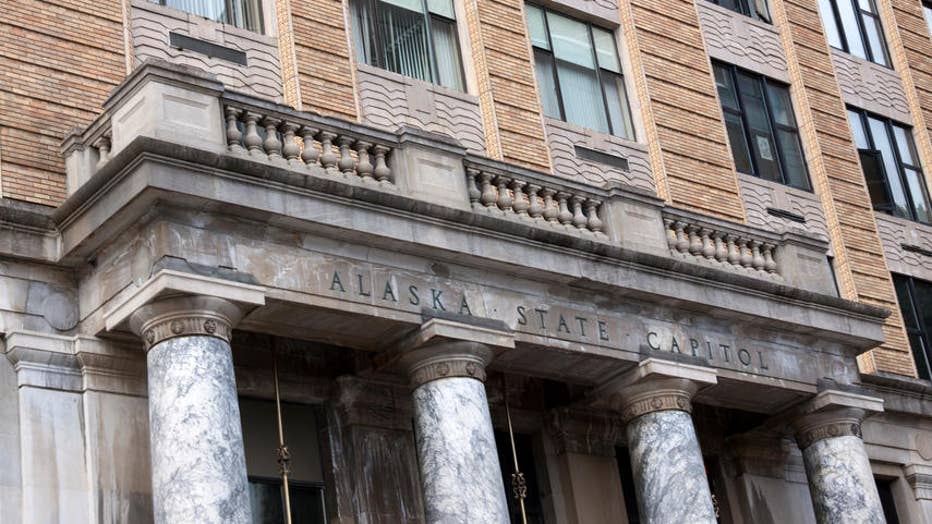
Photo Credit: Panther Media GmbH / Alamy Stock Photo
6. Alaska

Photo Credit: API / Alamy Stock Photo
5. Vermont

Photo Credit: Purestock / Alamy Stock Photo
4. New Jersey

Photo Credit: Sean Pavone / Alamy Stock Photo
3. Connecticut
Photo Credit: Vlad Ghiea / Alamy Stock Photo
2. District of Columbia

Photo Credit: Harold Stiver / Alamy Stock Photo
1. New York
Methodology:
Unless otherwise noted, the data presented in this analysis is for public elementary and secondary schools only.
Current spending and enrollment statistics are from the U.S. Census Bureau, “Annual Survey of School System Finances” (2016), released in May of 2018. Current spending represents the amount spent by schools on daily operations, not including debt service, capital outlay, or reimbursement to other governments. Teacher salary statistics are from the National Education Association, Estimates of School Statistics, 2016-17. High school graduation rates are from the U.S. Department of Education, EDFacts Data (2015-2016). The graduation rate presented is the public high school 4-year adjusted cohort graduation rate.
Nation’s Report Card performance was evaluated using 2017 data from the Institute of Education Sciences, National Assessment of Educational Progress (NAEP) Math and Reading assessments for 8th grade students. For each state, the NAEP Math and Reading scores were averaged. The resulting averages were converted to percentiles and given qualitative scores.
The list of states is ranked by per pupil current spending for Fiscal Year 2016.